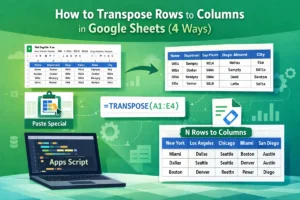


How to Use Watch Window in Excel: All Things Explained
When working with complex Excel workbooks that contain multiple sheets and formulas, it can be difficult to keep track of important cell values while analyzing data elsewhere. Scrolling back and forth to check specific figures wastes time and increases the chance of missing an update. In this article, you’ll learn what the Excel Watch Window is, how it works, and multiple ways to use and manage it effectively. This feature