
Excel Charts
How to Add Custom Error Bars in Excel (2 Easy & Quick Methods)
Learn how to add custom error bars in Excel with unique values. Perfect for showing precise data variability in your charts.
Read article

1285 articles
Learn how to add custom error bars in Excel with unique values. Perfect for showing precise data variability in your charts.
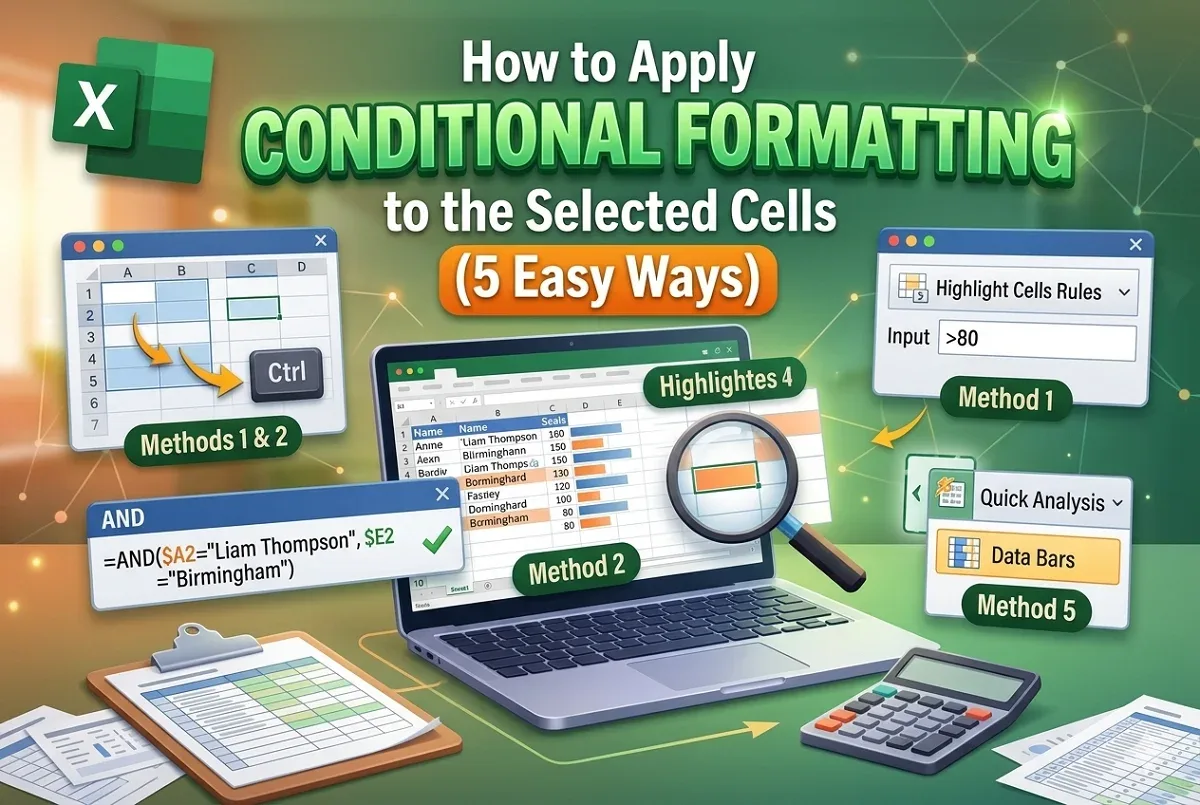
This article shows 5 ways to apply conditional formatting to selected non-adjacent cells, two columns, with formulas, & data bars option

Add individual error bars in Excel for each series with custom values using the Format Error Bars pane options.

A guide to value axis in Excel. Learn how to customize scales, add secondary axes & modify Y-values and essential tips for chart formatting.

Add error bars in Excel using Chart Elements, Design tab. Includes individual measurements, customizing, and plotting horizontal error bars.

Learn how to write 001 in Excel by using custom formatting, text format & different Excel functions to keep leading zeros for codes, IDs etc.

This article explores how to calculate mean and standard deviation in Excel using AVERAGE & STDEV.S functions and a discussion of the result.

Add outside end data labels in Excel using Chart Elements, Design tab or right-click. Prevent label overlap for professional charts.

Learn how to format data labels in Excel with custom fonts, colors & positions, formatting, leader lines & text rotation for clear charts.

Learn with easy steps on how to create a data entry form with a drop-down list in Excel to simplify data input & maintain input accuracy.
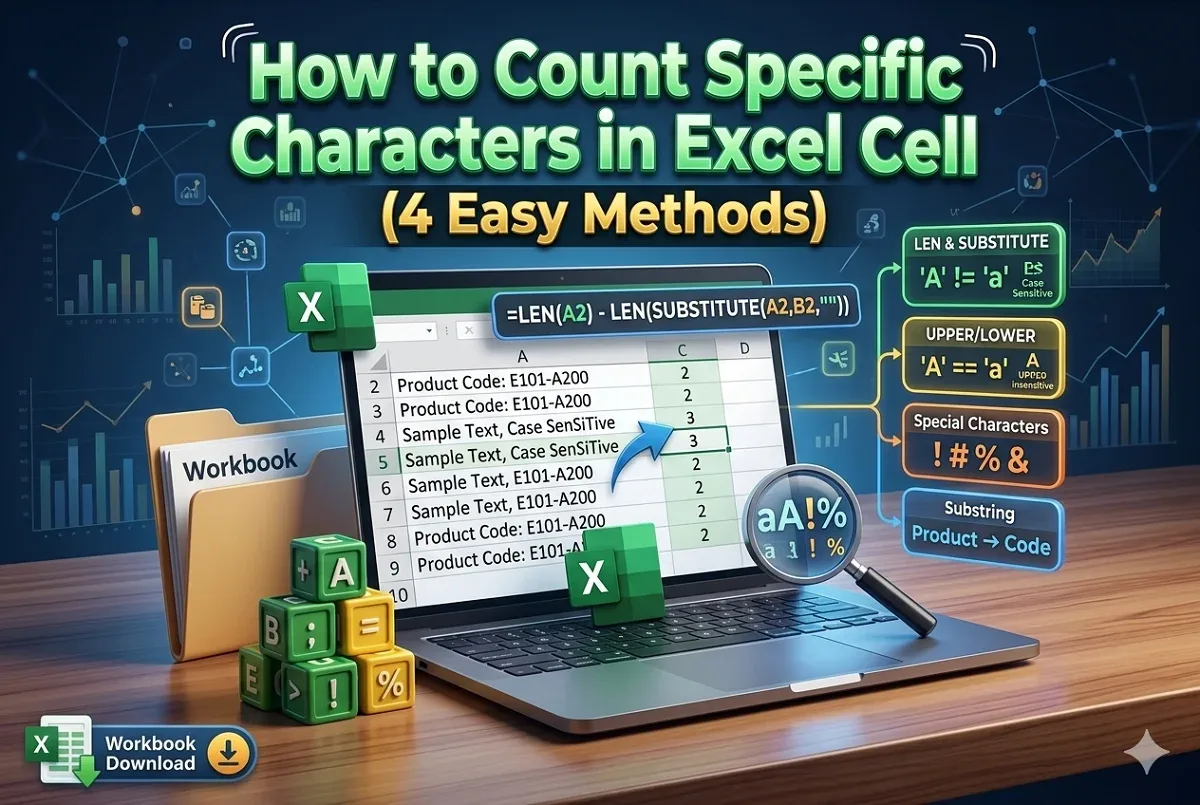
This article covers four diverse ways with use cases to count specific characters in an Excel cell with step by step guide.

This article explores standard deviation with if condition in Excel for single and multiple criteria using STDEV.S and IF functions.